What are KPIs and which ones to track in your business: 15 key indicators with examples (2026)
What are KPIs: the indicators that show whether your business is meeting its goals. Here are 15 KPIs by area, with formula and example, and how to choose yours.
· 4 min read
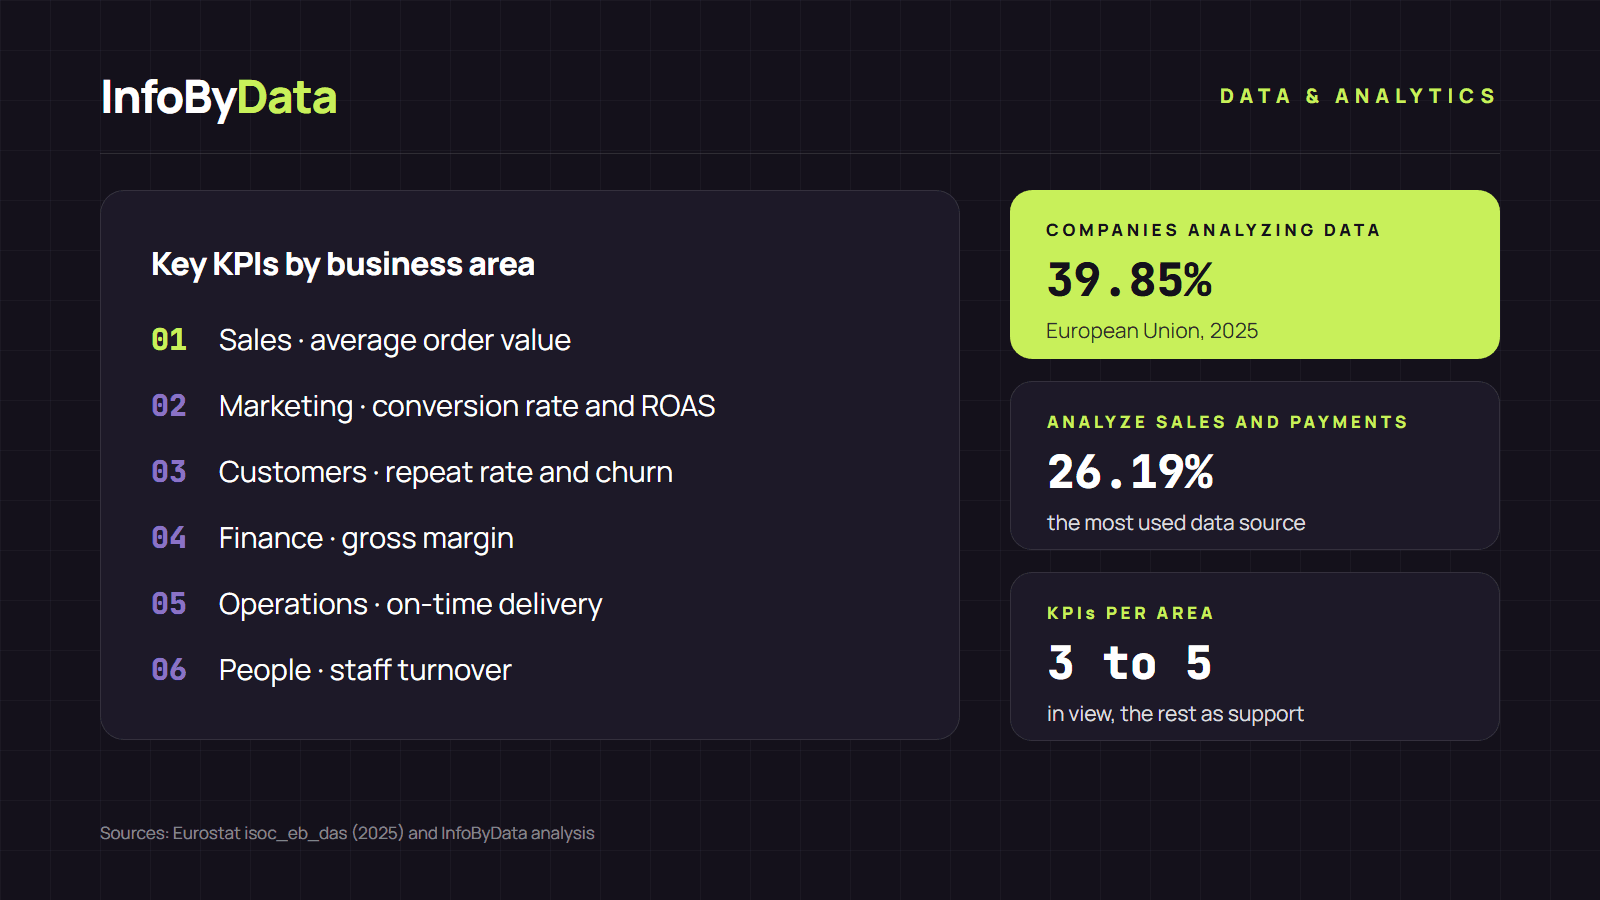
39.85% of companies in the European Union with 10 or more employees analyzed data in 2025, according to Eurostat. The most common source is sales and payment records (26.19%), followed by customer data (17.62%). Having data is now common. The hard part is knowing which numbers to watch, and that is what KPIs are for.
In this guide we explain what KPIs are, how they differ from any other metric, which ones to track in each area of the business (with formula and example) and how to choose yours.
What are KPIs: definition
KPI stands for key performance indicator. It is a figure that shows whether the company, a team or a campaign is moving toward a specific goal.
Every KPI is a metric, but not every metric is a KPI. Website visits are a metric. They become a KPI when they are tied to a goal ("reach 20,000 organic visits a month by June") and when someone makes decisions based on how they move.
A good KPI meets four conditions:
- It is tied to a goal, with a number and a deadline.
- It can be measured with reliable data, always in the same way.
- It has an owner, who reviews it and acts.
- It leads to a decision: if it goes up or down, something changes.
How many KPIs to track
Fewer than you might think. In their study for the American Economic Review, economists Erik Brynjolfsson and Kristina McElheran considered a plant data-driven if, among other conditions, it tracked 10 or more key indicators and had short- and long-term targets. That figure is a reference for the whole company, not for each person: a team works better with 3 to 5 KPIs in view and the rest as supporting metrics.
15 KPIs by area, with formula and example
| Area | KPI | Formula | Example |
|---|---|---|---|
| Sales | Sales for the period | Sum of net sales | $45 million in October |
| Sales | Average order value | Sales ÷ number of purchases | $45,000,000 ÷ 1,500 = $30,000 |
| Sales | Close rate | Deals closed ÷ opportunities × 100 | 30 ÷ 120 = 25% |
| Marketing | Conversion rate | Conversions ÷ visits × 100 | 600 ÷ 20,000 = 3% |
| Marketing | Cost per acquisition (CPA) | Ad spend ÷ new customers | $1,200,000 ÷ 80 = $15,000 |
| Marketing | ROAS | Ad revenue ÷ ad spend | $4,800,000 ÷ $1,200,000 = 4x |
| Customers | Repeat purchase rate | Returning customers ÷ total customers × 100 | 420 ÷ 1,500 = 28% |
| Customers | Churn rate | Customers lost in the month ÷ customers at start × 100 | 45 ÷ 900 = 5% |
| Customers | Customer lifetime value (LTV) | Average order × purchases per year × years as customer | $30,000 × 4 × 3 = $360,000 |
| Finance | Gross margin | (Sales − cost of goods sold) ÷ sales × 100 | ($45M − $27M) ÷ $45M = 40% |
| Finance | Break-even point | Fixed costs ÷ margin per unit | $9,000,000 ÷ $12,000 = 750 units |
| Finance | Days sales outstanding | Receivables ÷ credit sales × 30 | $18M ÷ $27M × 30 = 20 days |
| Operations | On-time delivery | Orders delivered on time ÷ total orders × 100 | 1,380 ÷ 1,500 = 92% |
| Operations | Inventory turnover | Cost of goods sold ÷ average inventory | $27M ÷ $9M = 3 times in the month |
| People | Staff turnover | Departures in the year ÷ average headcount × 100 | 6 ÷ 40 = 15% |
The examples are illustrative, to show how each formula is applied (amounts in Chilean pesos).
Several of these KPIs have their own guide on InfoByData: ROAS and what a good ROAS is, marketing KPIs with benchmarks and margin and selling price.
How to choose your company's KPIs in 5 steps
- Start with the goal, not the data. Ask what you want to achieve this year (grow sales, cut costs, retain customers) and only then which number shows it.
- Pick one or two KPIs per goal. If a goal has six indicators, none of them leads.
- Combine outcome and leading indicators. Monthly sales tell you what already happened. Conversion rate or open opportunities anticipate what is coming.
- Define the source and frequency. Note where each number comes from (sales system, Google Analytics, accounting) and how often it is reviewed. If you measure campaigns, tag your links with UTM parameters to know which channel each sale comes from.
- Review your KPIs every quarter. A KPI nobody uses to decide is just another metric: replace it.
Common mistakes when measuring KPIs
- Vanity metrics: followers, likes or total visits look good in a report but rarely explain sales.
- Measuring without a target: a KPI without a goal number doesn't tell you whether you're on track.
- Changing how it's calculated: if the formula changes from one month to the next, the comparison stops working.
- Confusing correlation with causation: two KPIs rising together doesn't mean one causes the other. To prove a cause, the tool is an A/B test.
What it means for you
- Understanding what KPIs are sets priorities: a KPI turns a vague goal ("sell more") into a number the whole team understands and can follow.
- Less is more: 3 to 5 KPIs per area are enough. The rest can live in a supporting report without pulling focus from what matters.
- KPIs are worth it only if they lead to decisions: test each indicator with a simple question: if this number changes, what would we do differently? If the answer is "nothing", it's not a KPI.
To keep going, read what data-driven means and how to apply it in your company.
Sources
- what are KPIs
- KPI
- key performance indicators
- metrics
- dashboard
- data-driven