Marketing KPIs: the 5 key metrics and the benchmarks to compare against (2026)
Winning a new customer costs 5 to 25 times more than keeping an existing one, and a Google ad converts at 7.52% on average. These are the metrics to measure first, with benchmark figures to know whether you're on track.
By Paulina · SEO and digital strategy specialist
· 3 min read
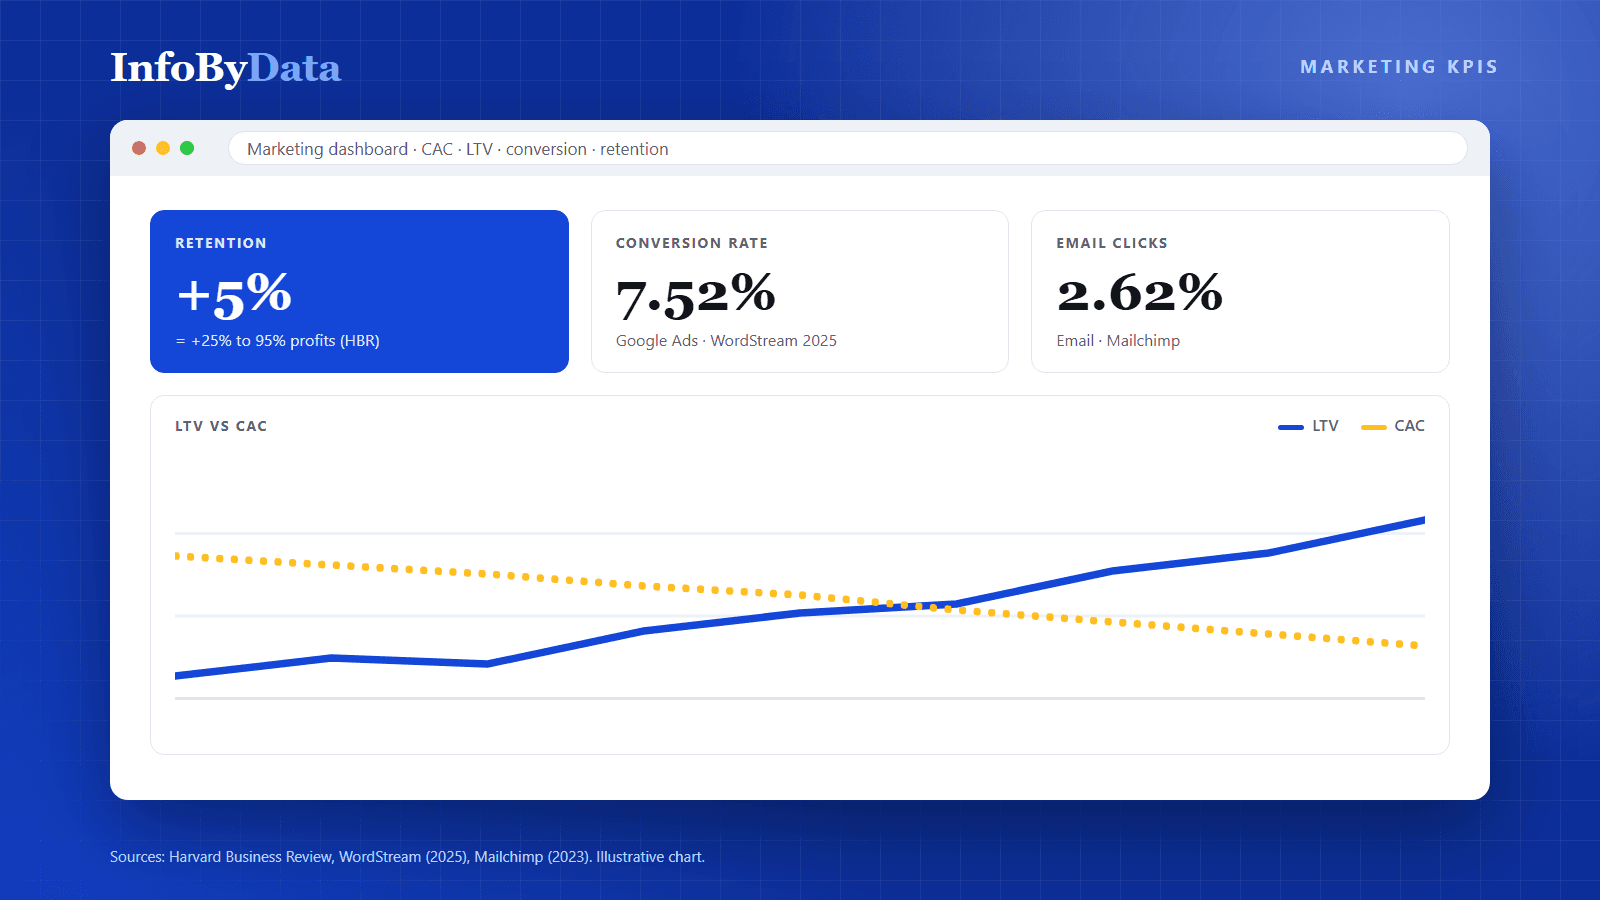
Acquiring a new customer costs between 5 and 25 times more than keeping one you already have, according to the Harvard Business Review. That's why a good marketing dashboard isn't the one with the most numbers, but the one that shows how much growth costs and whether that growth is profitable.
These are the five KPIs (key performance indicators) to measure first, with benchmark figures to compare your results.
1. Customer acquisition cost (CAC)
How much it costs, on average, to win a new customer. Add up what you spent on marketing and sales in a period and divide it by the new customers in that period.
Example calculation: if in one month you spend CLP 2,000,000 on advertising and sales salaries and win 80 new customers, your CAC is CLP 25,000.
It's worth calculating it by channel (paid search, social media, email, organic): an overall average can hide a channel that isn't profitable.
2. Customer lifetime value (LTV)
How much money a customer brings in over their whole relationship with the company. Estimate it by multiplying the average order value by the number of purchases per year and by the number of years the customer stays.
LTV only makes sense compared with CAC: if a customer brings in less than it costs to win them, growing faster only grows the loss.
3. Conversion rate, CTR and cost per lead
What percentage of visits or clicks ends in a purchase or a lead. In search advertising you also measure CTR (the share of people who click the ad) and cost per lead.
The WordStream study of 16,446 Google Ads campaigns in the United States (April 2024 to March 2025) gives these all-industry averages:
| Google Ads metric | 2025 average |
|---|---|
| CTR (clicks over impressions) | 6.66% |
| Cost per click | US$5.26 |
| Conversion rate | 7.52% |
| Cost per lead | US$70.11 |
These are U.S. figures, where clicks tend to be more expensive than in Latin America. They work better as a reference for the percentages than for the costs.
4. Email marketing metrics
Email is still one of the cheapest channels for staying in touch with customers. According to Mailchimp's benchmarks (updated December 2023), the average across all its users is:
Source: Mailchimp, benchmarks updated December 2023
View the data as a table
| Open rate | 35.63% |
| Click rate | 2.62% |
| Unsubscribe rate | 0.22% |
In e-commerce, the average open rate drops to 29.81% and clicks to 1.74%. Mailchimp warns that open rates may be inflated by Apple Mail's privacy feature, which marks emails as opened even if the person doesn't read them. That's why clicks deserve more weight.
5. Retention rate
What percentage of customers buy again in a period. It's the KPI with the biggest impact on profitability: according to research by Frederick Reichheld of Bain & Company, cited by the Harvard Business Review, increasing retention by 5% can raise profits by 25% to 95%.
The range is wide because it depends on the industry, but the conclusion holds: a returning customer costs far less than a new one.
Summary: what to measure and what to compare it with
| KPI | What it answers | Benchmark |
|---|---|---|
| CAC | How much does a new customer cost me? | Compare it by channel and against LTV |
| LTV | How much does a customer bring in over time? | It must be higher than CAC |
| Google Ads conversion | How many clicks become leads or sales? | 7.52% average (WordStream) |
| Email clicks | How many readers take action? | 2.62% average (Mailchimp) |
| Retention | How many customers come back? | +5% retention = +25% to 95% profits (HBR) |
What it means for you
- Calculate CAC by channel before raising your budget: that way you'll know which channel to scale and which to fix.
- Always compare LTV with CAC: it's the most direct way to know whether your growth is profitable.
- Invest in keeping customers, not just attracting them: with acquisition 5 to 25 times more expensive, improving retention is usually the cheapest lever.
Sources
- marketing KPIs
- CAC
- LTV
- conversion rate
- benchmarks