What is an A/B test and how to run one step by step: an example with real data (2026)
What is an A/B test: comparing two versions with real traffic to see which converts better. At a 5% conversion rate you need 31,234 visits per version.
· 5 min read
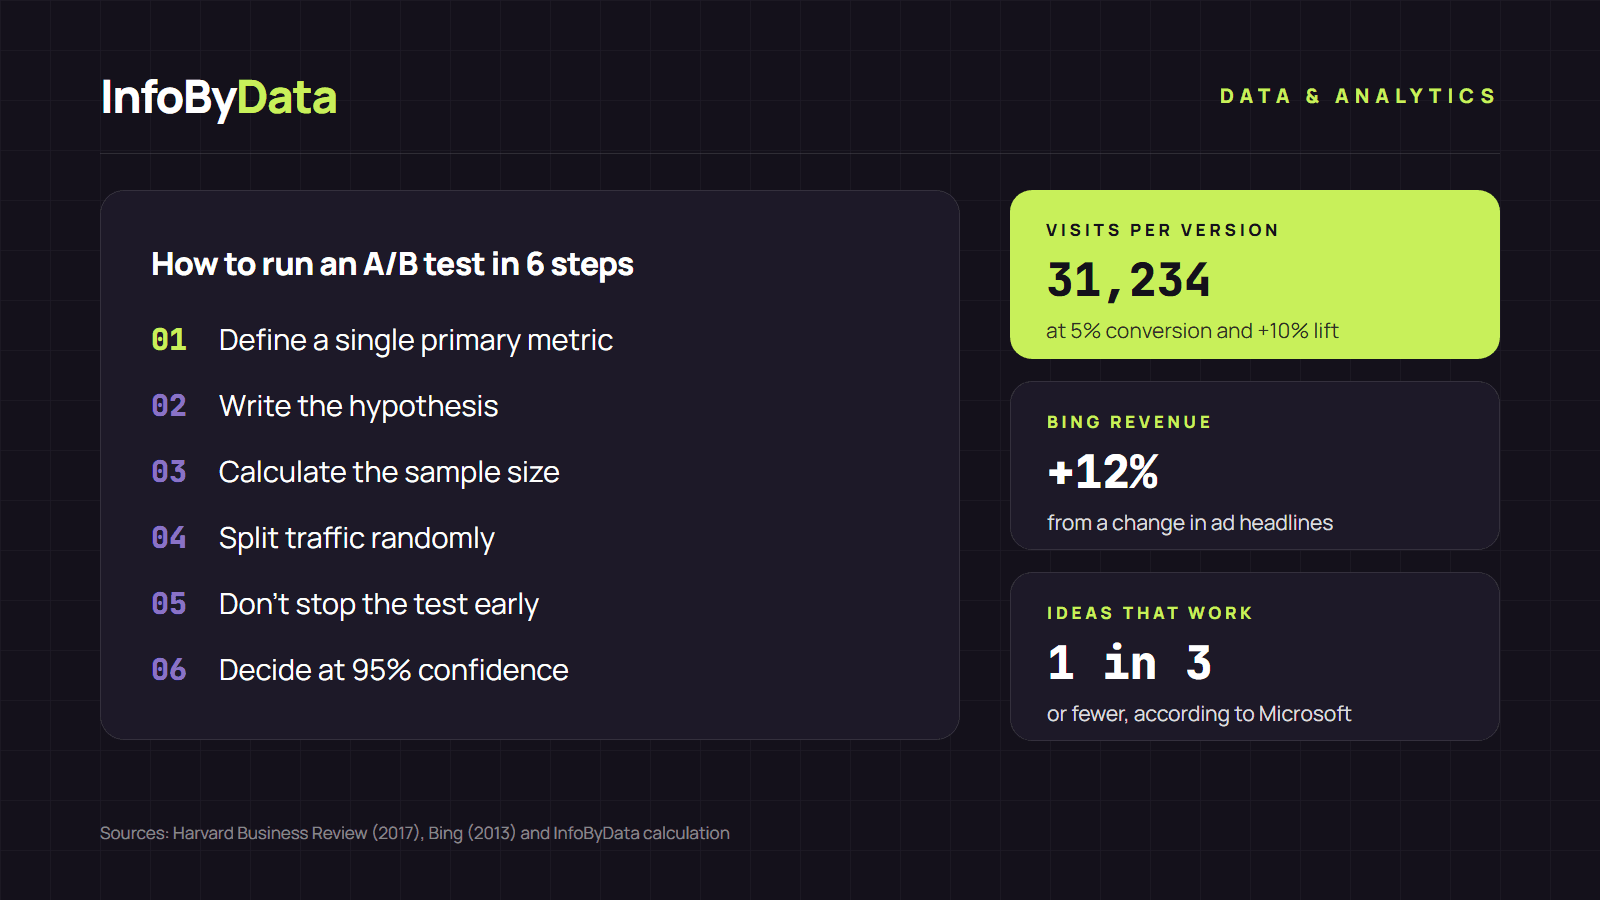
A change in how Bing displayed its ad headlines increased revenue by 12%, more than US$100 million a year in the United States alone, according to Ronny Kohavi, who led experimentation at Microsoft, writing in Harvard Business Review. The idea had sat on the backlog for months because nobody believed in it. An A/B test found it.
Understanding what an A/B test is helps you decide with evidence rather than intuition. In this guide we explain how it works, how many visits you need, how to read the result and how to run one step by step, with a worked example.
12%
Bing revenue increase
from a change in ad headlines
250
Daily experiments at Bing
over 250 running in parallel, 2013
1 in 3
Ideas that improve the metric
or fewer, according to Microsoft
31,234
Visits per version
at 5% conversion and +10% lift
Source: Harvard Business Review, 2017; Bing, 2013; InfoByData calculation
View the data as a table
| Bing revenue increase | 12% | from a change in ad headlines |
| Daily experiments at Bing | 250 | over 250 running in parallel, 2013 |
| Ideas that improve the metric | 1 in 3 | or fewer, according to Microsoft |
| Visits per version | 31,234 | at 5% conversion and +10% lift |
What is an A/B test
An A/B test is an experiment in which you show two versions of something, the current one (A) and an alternative (B), to randomly assigned groups of people, and measure which achieves the better result on a metric defined in advance: purchases, sign-ups, clicks or revenue.
Randomness is the key. Because each person lands in A or B by chance, the two groups are comparable, and any difference in results can be attributed to the change, not to the time of day, the campaign or the type of customer. That is why an A/B test gives you proof of cause and effect, something an analytics report alone cannot.
You can test almost anything: a button's text, the shipping price, an email subject line, the order of a form or the design of an entire page.
Why run A/B tests: most ideas don't work
The strongest reason to test is that our intuitions often fail. In a Bing blog post, Microsoft explained that less than a third of the ideas it tests move the metrics they were designed to improve, and that in a highly optimized product such as its search engine, the share is even lower.
The same post shows the scale: Bing had more than 250 experiments running every day, and almost every user was in about 15 at once. A test on ad site links improved revenue by "tens of millions of dollars per year" with no negative impact on users.
For a small business the lesson is the same: if two out of three changes improve nothing (or make things worse), launching without measuring means piling up changes that add nothing.
How many visits you need: sample size
Before starting, you need to calculate how many visits each version requires. It depends on two numbers: your current conversion rate and the minimum lift you care to detect. The lower the conversion rate and the smaller the lift, the more visits you need.
- To detect +10%
- To detect +20%
Source: InfoByData calculation at 95% confidence and 80% power
View the data as a table
| To detect +10% | To detect +20% | |
|---|---|---|
| 2% conversion | 80,682 | 21,109 |
| 5% conversion | 31,234 | 8,158 |
| 10% conversion | 14,751 | 3,841 |
At a 5% conversion rate, detecting a 10% lift (from 5% to 5.5%) requires 31,234 visits per version, more than 62,000 in total. If detecting a 20% lift is enough, the figure drops to 8,158. You can run this calculation with your own data in our calculator.
How to read the result: statistical significance
You don't read an A/B test by looking at which version has more conversions. You read it through statistical significance: the probability that the difference you see is just chance. The standard is to require 95% confidence, that is, a p-value below 0.05.
Worked example. An online store tests a new buy button:
| Version | Visits | Purchases | Conversion |
|---|---|---|---|
| A (current) | 10,000 | 500 | 5.0% |
| B (new) | 10,000 | 560 | 5.6% |
Version B converts 12% better, but the p-value is 0.058: it does not reach 95% confidence. With those visits, the difference could still be chance. If the store keeps the test running to 20,000 visits per version and the ratio holds (1,000 vs. 1,120 purchases), the p-value falls to 0.007 and the result is significant.
The lesson: an A/B test with too few visits can show a "winner" that doesn't exist.
How to run an A/B test step by step
- Define a single primary metric. For example, purchase rate. If you measure ten things at once, one will "win" by chance.
- Write the hypothesis. "If we change the button to 'Buy now', the purchase rate will rise because the call to action is clearer."
- Calculate the sample size from your current conversion rate and the minimum lift you care about.
- Split traffic randomly into equal parts, using a testing tool or your e-commerce or email platform.
- Don't peek early. Stopping the test as soon as a winner appears is the most common mistake: it inflates false positives. Run at least one or two full weeks to cover weekdays and weekends.
- Read the significance and decide: ship B, keep A or design a new test.
- Document the result, even if B lost. Knowing what doesn't work is data too.
A/B testing and SEO: what Google says
Testing page versions doesn't hurt rankings if done properly. Google Search Central's guidance asks for three things: don't show Googlebot a different version from what people see (that is cloaking), use rel="canonical" on alternate URLs pointing to the original, and if you redirect to another URL, use a 302 (temporary) redirect, not a 301. It also recommends ending the test once you have a result and removing test scripts and URLs.
What it means for you
- Test before you change: if less than a third of ideas work, an A/B test keeps you from shipping changes that add nothing or cost you sales.
- Calculate the sample before you start: with little traffic, test big changes (a whole page, an offer), not details like a button color, which need tens of thousands of visits.
- Decide on significance, not gut feeling: a 12% difference may not be significant. Check the p-value before declaring a winner and let the test run as long as needed.
To go further, read about data-driven decision making and how to build a data-driven culture in your team.
Sources
- Harvard Business Review, "The Surprising Power of Online Experiments" (2017)
- Bing, "Large Scale Experimentation at Bing" (2013)
- Google Search Central, website testing best practices
- InfoByData calculations: two-proportion z-test at 95% confidence and 80% power
- what is an A/B test
- A/B test
- statistical significance
- sample size
- conversion rate
- experiments