Household spending in Chile: where the family budget goes, according to the INE
Household spending in Chile averages CLP 1,451,782 a month, per the INE. Food takes 21.2%, and only the richest fifth of households spends less than it earns.
· 2 min read
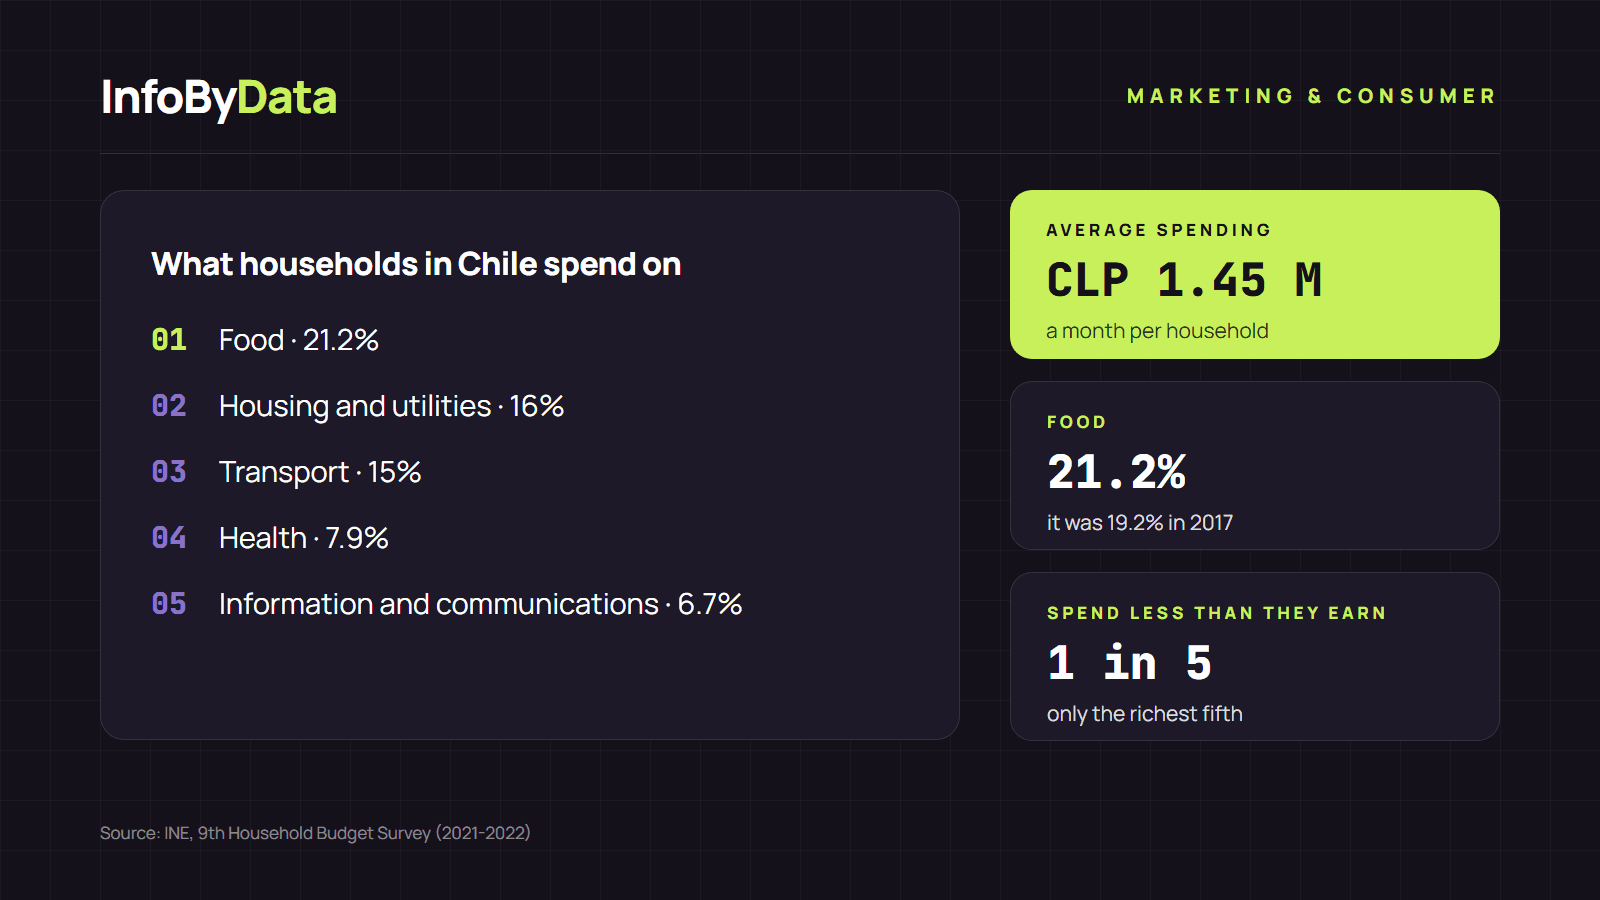
Household spending in Chile averages CLP 1,451,782 a month, according to the 9th Household Budget Survey (EPF) by the INE, Chile's statistics agency, the country's broadest snapshot of consumption. Half of households spend at most about CLP 1.1 million. The largest item is food, at 21.2% of the budget.
CLP 1,451,782
Average monthly spending
per household
CLP 1,413,349
Average monthly income
excluding imputed rent
21.2%
Food
of total spending
Source: INE, 9th Household Budget Survey (October 2021 to September 2022)
View the data as a table
| Average monthly spending | CLP 1,451,782 | per household |
| Average monthly income | CLP 1,413,349 | excluding imputed rent |
| Food | 21.2% | of total spending |
Where household spending in Chile goes
The EPF surveyed 15,134 households in regional capitals between October 2021 and September 2022. This is how the budget is split:
Food, housing and transport account for more than half of spending. On food alone, the average household spends CLP 307,947 a month.
How consumption has changed since 2017
Compared with the previous survey (2016-2017), households spend a larger share on essentials and a smaller share on everything else:
| Item | 2016-2017 | 2021-2022 |
|---|---|---|
| Food | 19.2% | 21.2% |
| Housing and utilities | 14.5% | 16.0% |
| Insurance and financial services | 3.5% | 4.5% |
| Education | 6.5% | 4.0% |
| Recreation, sport and culture | 5.3% | 4.4% |
| Clothing and footwear | 3.5% | 2.8% |
Source: INE, 9th Household Budget Survey.
The INE highlights two changes: the rise in food and the drop in education.
Who spends more than they earn
The survey's most striking finding is that only the highest-income fifth of households spends less than it earns. The poorest 20% of households earn an average of CLP 462,503 a month but spend CLP 901,162. The top fifth, by contrast, earns more than CLP 3.2 million and spends about CLP 2.5 million.
By area, household spending in Chile is higher in Greater Santiago (CLP 1,590,105) than in the northern (CLP 1,325,057), central (CLP 1,254,635) and southern (CLP 1,247,895) macro-zones.
What it means for you
- If you sell, look at where the budget goes. Food, housing and transport take more than half of household spending in Chile: they are the biggest markets, but also the most sensitive to inflation.
- Discretionary spending is losing ground. Clothing, recreation and education have shrunk their share since 2017, so they compete for a tighter budget.
- Many households run a deficit. That only the richest fifth spends less than it earns explains the use of credit and installments. If you run a business, check how to price correctly with our margin calculator.
Sources
- household spending in Chile
- consumer spending
- Household Budget Survey
- INE
- buying behavior
- family budget