Many people don’t know about “Interquartile Range Google Sheets”, In today’s world, where data calls the shots, the ability to dissect information with flair is a skill worth its weight in gigabytes. Whether you’re a student, a researcher, or a business aficionado, you’ve probably grappled with mammoth datasets that seem as complex as a Rubik’s Cube. But fear not! Google Sheets, that trusty spreadsheet sidekick, comes to your rescue with a secret weapon – the Interquartile Range (IQR). It’s the Sherlock Holmes of data analysis, and in this article, we’re about to unravel why it’s elementary, my dear readers!

Getting to Know the Basics: The Lowdown on Interquartile Range (IQR)
Before we dive headfirst into the world of IQR in Google Sheets, let’s first clear the fog around this term. In simpler terms, IQR is like a data GPS that helps you navigate the treacherous terrain of data spreads. It’s the GPS that guides you through the middle 50% of your data, steering clear of data potholes and roadblocks.
Why Should You Care About IQR? Here’s a Chuckle-worthy Tale!
But why, you ask? Well, imagine this: you’re planning a picnic, and you’ve got a basket full of sandwiches. You’ve got regular sandwiches, but you’ve also got one sandwich that’s the size of a beach towel! Now, if you calculate the average size of sandwiches, that monster sandwich will skew the results and make it seem like you’re feeding a horde of giants. That’s where IQR comes in as your sandwich size equalizer!
1. Playing Whack-a-Mole with Outliers
IQR is like a shield against data outliers – those wild, unpredictable data points that are like the party crashers of your dataset. While other methods tremble in their spreadsheets, IQR stands tall and resilient.
2. Shedding Light on the Data Disco
By shaking hands with IQR, you can shine a spotlight on how your data folks are dancing in the middle of the data disco. It’s like being the DJ of your data party, knowing where the real groove is happening.
Crunching Numbers: How to Calculate IQR in Google Sheets (No Capes Required!)
Now, let’s get down to business and see how you can whip up some IQR magic in Google Sheets. It’s easier than teaching a cat to play fetch:
Step 1: Data Dress-Up Time
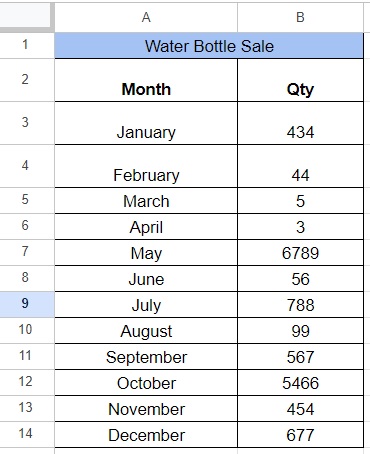
Start by giving your dataset a makeover in a Google Sheets spreadsheet. Think of it as getting your data all dressed up for a fancy party, complete with snazzy column headers.

Step 2: Quartile Quest
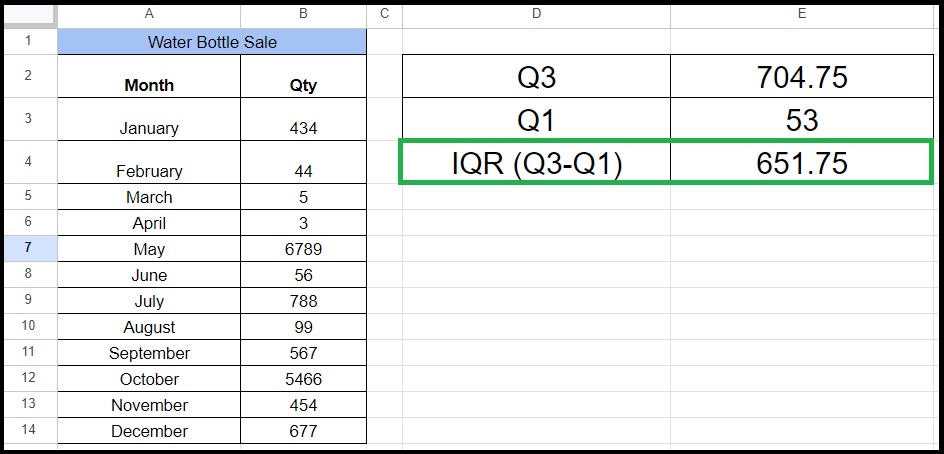
To summon the power of IQR, you need to find two key players: the first quartile (Q1) and the third quartile (Q3) of your dataset. Think of them as the Batman and Robin of your data analysis, and Google Sheets has their Bat-Signal, known as QUARTILE.INC.

Step 3: IQR – The Data Magician
With Q1 and Q3 in your corner, calculating the IQR is as easy as pulling a rabbit out of a hat. Just subtract Q1 from Q3: IQR = Q3 – Q1. No wands or top hats required!

Putting IQR to Work: Practical Applications and a Dash of Humor
Now that you’ve got IQR in your data toolbox, let’s explore where it comes to the rescue in the real world. And to spice things up, here’s a funny anecdote:
Imagine you’re at a surprise birthday party, and the guest list includes everyone from your grandma to your teenage cousin. Now, picture a giant cake that’s enough to feed an army. If you cut it into tiny pieces, your grandma’s slice is bigger than she can handle, and your cousin’s slice is barely a nibble. That’s when you need IQR as the cake portion regulator!
1. Spotting Outliers: The Data Party Crashers
IQR is your bouncer at the data nightclub, swiftly spotting those troublemakers that fall below Q1 – 1.5 * IQR or above Q3 + 1.5 * IQR. Say goodbye to the rowdy data outliers!
2. Making Data Comparisons: Data vs. Data Showdown
When your datasets enter the ring for a wrestling match, IQR is your referee. It helps you gauge who’s packing more punch and who’s just throwing data tantrums.
3. Data Cleaning: Sweeping Up the Data Confetti
In the post-data party cleanup, IQR is your trusty broom, helping you sweep away those data crumbs that might be messy or need some extra attention.
In Conclusion: IQR – Your Data Sidekick
In conclusion, the Interquartile Range (IQR) in Google Sheets is your trusty sidekick on your data analysis adventures. It’s the data detective that helps you solve mysteries, spot the outliers, and keep your data party in check. So, put on your data-sleuthing hat, follow the steps outlined in this article, and let IQR be your guide to data mastery – all with a dash of humor and a slice of cake!
FAQs
1. Can I use IQR in Google Sheets for both small and large datasets?
Yes, IQR is suitable for datasets of all sizes, making it a flexible choice for data analysis.
2. Are there any limitations to using IQR in data analysis?
While IQR is robust, it may not capture all nuances in highly skewed datasets. In such cases, additional statistical measures may be necessary.
3. What does it mean if the IQR is close to zero?
A small IQR indicates that the data points are closely clustered, suggesting low variability.
4. Can I use IQR to compare data from different sources?
Yes, IQR is an effective tool for comparing data from various sources as it focuses on data distribution within the middle 50%.
5. Is there a shortcut to calculate IQR in Google Sheets?
Yes, you can use the IQR function in Google Sheets to calculate it directly, saving you time and effort in manual calculations.
Interquartile Range Google Sheets
You May be Interested to know “How to Make Categories in Google Sheet“