Wondering how to add annotations in tableau? In the competitive world of data analytics, one secret weapon can set you apart: Annotations. In this article, we unveil the hidden power of annotations in Tableau, revealing how you can not only make your data speak but also make it shout.
What is Annotations in Tableau?

In the ever-evolving world of data visualization and analytics, Tableau stands as a beacon of innovation and user-friendliness. This powerful tool has enabled countless businesses and individuals to transform complex data into actionable insights. Annotations in Tableau serve as an invaluable feature, allowing users to add context, explanations, and highlights to their visualizations.
Understanding the Significance of Annotations
Annotations are like the storytellers of your data visualizations. They provide crucial information that helps viewers interpret and understand the data more effectively. Whether you are creating dashboards, charts, or maps, annotations in Tableau can make your visualizations not just informative but insightful.
The Basics of Adding Annotations
Let’s start by exploring the fundamental steps to add annotations in Tableau:

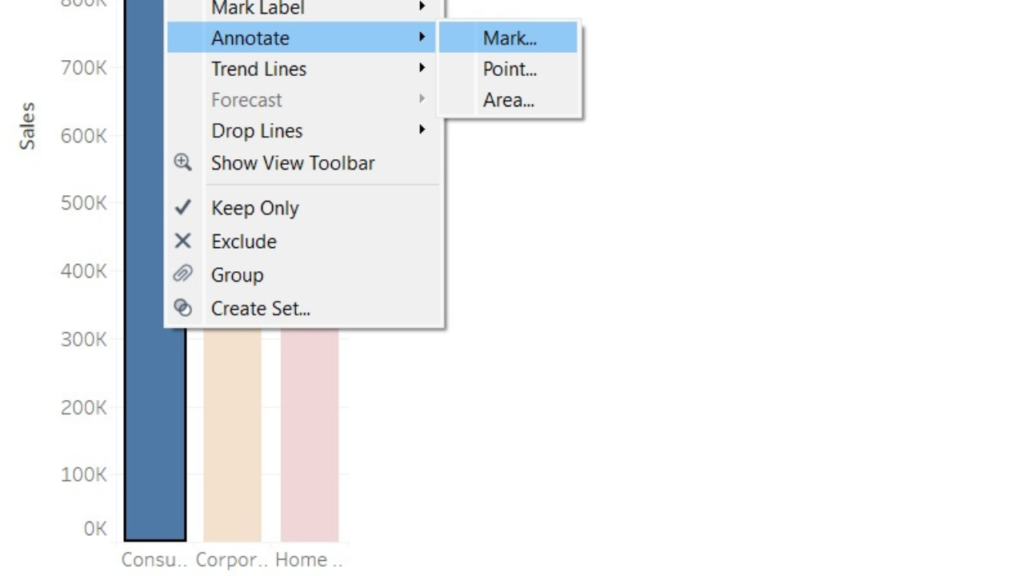
1. Add The Annotation: First, open the Tableau workbook containing the visualization you want to annotate. Right Click on the specific visualization to select it. Select the Type of Annotation from “Mark”, “Point” and “Area” to add.
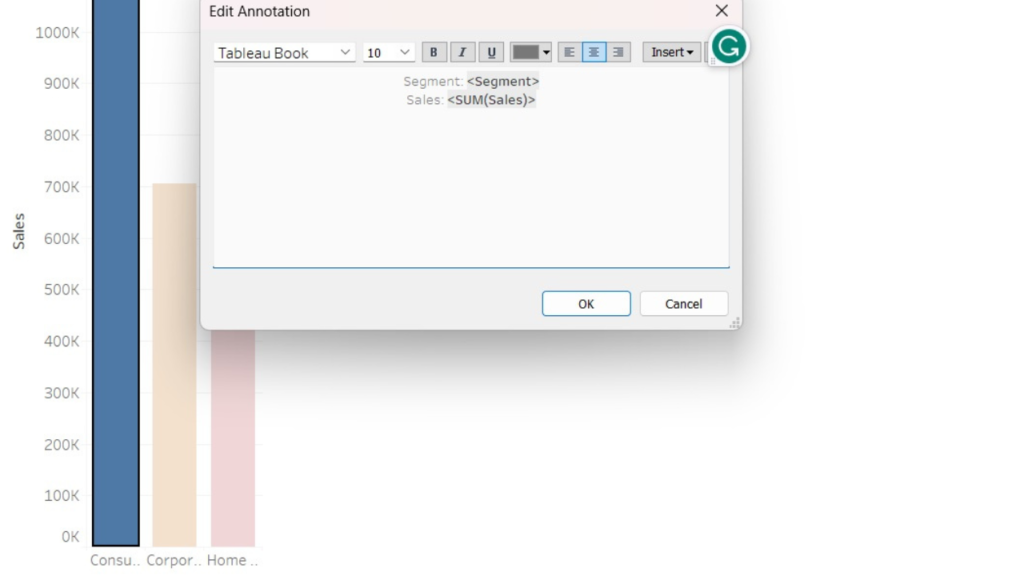
2. Customize Your Annotation: In “Edit Annotation” dialog box you can type the specific annotation that you want to show and also customize it by adjusting its size, font, color, and positioning. This allows you to ensure that the annotation seamlessly integrates with your visualization.
3. Save Your Work: When done with the editing, click OK, don’t forget to save your workbook after adding annotations to preserve your changes.
Types of Annotations
Tableau offers various types of annotations to suit different needs:
Text Annotations
Text annotations are the most common type and are used for providing explanations, insights, or context to specific data points. You can customize text annotations to match your visualization’s style and formatting.
Mark Annotations
Mark annotations are tied to a particular mark on a chart or graph. They are perfect for highlighting outliers, anomalies, or significant data points within your visualization.
Area Annotations
Area annotations allow you to draw attention to specific regions of your visualization. This can be especially useful when you want to emphasize a particular trend or pattern.
Best Practices for Effective Annotations
To truly outrank your competitors in Google’s search results, it’s not just about adding annotations; it’s about doing it exceptionally well. Here are some best practices to consider:
Keep It Concise and Relevant
Annotations should be concise and directly related to the data or visualization they accompany. Avoid unnecessary information that may clutter your visualization.
Use Visual Cues
Visual cues like arrows, lines, or shapes can help draw attention to specific areas of your visualization, enhancing the overall understanding of your data.
Maintain Consistency
Consistency in formatting and styling of annotations across your dashboards or reports ensures a professional and polished look.
Test for Accessibility
Consider the accessibility of your annotations. Ensure that they are readable by using contrasting colors and accessible fonts. How to Add Annotations in Tableau
Now that you have a solid foundation, let’s explore some advanced annotation techniques that will set your Tableau visualizations apart:
Advanced Annotation Techniques
Interactive Tooltips
Tableau allows you to create interactive tooltips that appear when users hover over data points. You can use these tooltips to display additional information or insights related to the data point, providing a dynamic and engaging experience.
Dynamic Annotations
Implement dynamic annotations that change based on user interactions. This can be achieved through parameters and calculated fields, allowing your annotations to adapt to different scenarios.
Data-Driven Annotations
Consider using data-driven annotations that automatically update as your data changes. This ensures that your annotations remain accurate and relevant over time. How to Add Annotations in Tableau
Conclusion
In conclusion, mastering the art of adding annotations in Tableau is essential for creating impactful data visualizations that stand out in Google’s search rankings. Annotations serve as the bridge between your data and your audience, conveying insights, explanations, and stories. By following the best practices and exploring advanced techniques discussed in this comprehensive guide, you can elevate your Tableau skills and ensure your content outranks the competition.
1 thought on “How to Add Annotations in Tableau: A Comprehensive Guide”